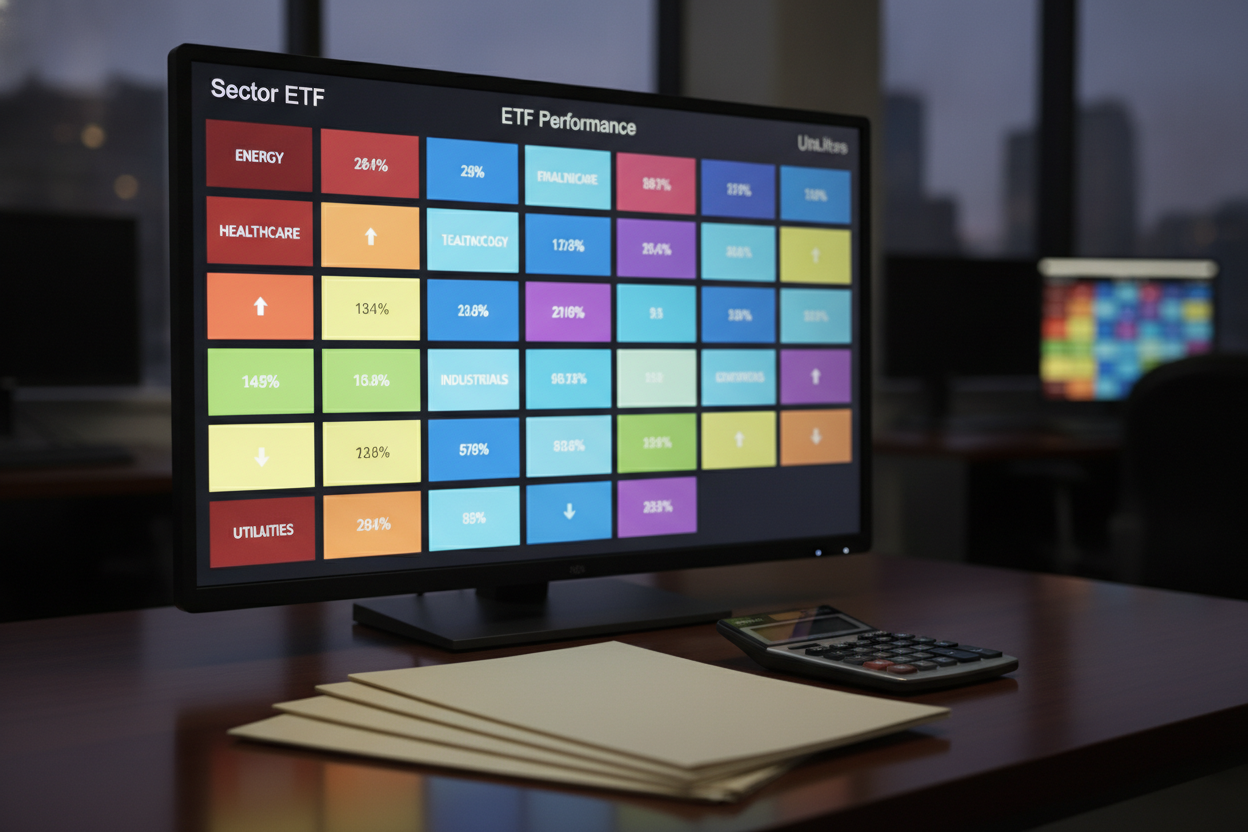
Sector ETFs are widely reported to charge low annual expense ratios, and BlackRock, State Street, and Vanguard collect every basis point of that fee regardless of whether their customers buy at the peak or the trough. So here is the question worth sitting with: if these products were engineered to segment the market into eleven separate fee streams, not to guide retail investors through economic cycle mechanics, who is responsible for bridging that gap? The answer is the investor, and understanding exactly where that gap opens is the only way to close it.
Asset managers like BlackRock, Vanguard, and State Street did not build sector ETF suites because they wanted retail investors to rotate tactically into semiconductors at the right moment. They built them because segmenting the market into eleven GICS sectors created eleven separate product lines, each with its own ticker, its own marketing narrative, and its own fee stream. That structural reality does not make sector ETFs bad instruments. It does mean the incentive to explain how cycle aware allocation actually works sits entirely with the investor, not the product manufacturer.
The Economic Cycle Architecture Behind Sector Performance
S&P 500 Sector Weight Concentration: Tech and Comms vs. Everything Else
S&P 500 Sector Weight Concentration
Tech and Comms vs. Everything Else (mid-2026)
Full S&P 500 (100%)
XLK Overweight Position (illustrative 50% tech)
Defensive Allocation (Utilities + Healthcare + Staples)
Source: Article reference, mid-2026 estimates
Sector performance does not move randomly. It follows a pattern tied to where the economy sits in its expansion and contraction cycle, and that pattern has been documented consistently enough across multiple decades to treat as a structural tendency rather than a coincidence. Early cycle conditions, when credit loosens and consumer spending recovers, have historically rewarded financials, consumer discretionary, and real estate. Late cycle environments, characterized by tight labor markets and rising input costs, have tended to favor energy and materials. Defensive sectors like utilities, healthcare, and consumer staples tend to hold ground during contraction when growth sectors sell off hard.
The Select Sector SPDR ETFs, which State Street is widely reported to have launched in the late 1990s as part of an early S&P 500 decomposition effort, were designed explicitly around this eleven sector framework. XLK for technology, XLE for energy, XLV for healthcare: the taxonomy itself encodes cycle logic. When the Federal Reserve began its rate cutting cycle in late 2024 and continued through 2025, financials and rate sensitive sectors repriced accordingly. Investors who understood that mechanism had a structural edge over those treating the same instruments as momentum bets.
The mechanism that makes cycle rotation work is not prescience about the future. It is a recognition that sector valuations and earnings tend to lead or lag GDP inflection points by identifiable windows, typically three to six months for early cycle signals and shorter for late cycle compression. That lag is the exploitable gap. Most retail strategies fail precisely here, because acting on a lagging signal feels like confirmation and usually arrives close to peak pricing.
Cycle aware sector allocation is less about prediction and more about not being systematically late. The investors who extract value from this framework are the ones tracking leading indicators, not the ones watching sector ETF inflows for timing cues. Those inflows are the lagging signal. And State Street, BlackRock, and Vanguard collect their expense ratios regardless of which side of that lag their customers are on.
Why Sector ETF Diversification Gets Complicated
Economic Cycle Rotation: Which Sectors Lead in Each Phase
Economic Cycle Rotation
Which sectors tend to lead in each phase
Leading indicator signals typically arrive 3 to 6 months before GDP inflection points
Source: Article: cycle-aware sector allocation framework
Understanding the cycle architecture is a necessary first step, but it does not solve a second problem that operates independently: the diversification properties of sector ETFs behave differently under stress than the labels imply. Here is the counterintuitive part. Sector ETF correlation to the broader S&P 500 rises sharply during market stress, right when you would most want it to fall. Technology and communication services together represent roughly 40% of S&P 500 weight as of mid 2026, which means an overweight position in XLK is not a diversification play relative to a total market fund. It is a concentration amplifier. The diversification argument for sector ETFs works best when the allocations are genuinely differentiated from the investor's existing core holdings, which most target date funds and simple three fund portfolios already contain implicitly.
Correlation spikes during stress are not a bug in sector ETF design. They reflect a basic feature of equity markets: when institutional investors need liquidity, they sell what is liquid, and sector ETFs are highly liquid by construction. The same feature that makes them efficient vehicles for tactical allocation makes them prone to correlated selloffs precisely when uncorrelated behavior would be most valuable. That is not a criticism of the product. It is a mechanical reality that position sizing has to account for.
A 5% tactical position in an energy ETF added to a portfolio that already holds 60% in a total market fund delivers meaningfully less sector exposure than the label suggests. The total market fund contains energy sector weight already. The incremental exposure from the tactical overlay is the difference between the two weights, not the full position size. Investors who do not account for this overlap are often surprised to find their sector bet had a smaller effect on overall portfolio performance than expected.
Sector pairs also carry embedded correlations that shift through the cycle. Energy and materials tend to move together during commodity expansions. Technology and consumer discretionary share consumer spending exposure and often correlate more tightly than their sector labels imply. Building a sector overlay without mapping these relationships is how investors create the illusion of diversification while actually stacking correlated bets. The correlation matrix is not static either: it shifts with the rate environment, the credit cycle, and global commodity flows. Product manufacturers have no obligation to flag that risk, and the architecture of the eleven sector GICS framework makes it easy to forget entirely. That asymmetry serves the asset manager far more than the retail investor holding the position.
How Position Sizing Controls Sector ETF Outcomes
Once the overlap and correlation problems are mapped, the next variable that determines whether a sector strategy actually works is position sizing. It is doing more work than most investors realize. A 10% allocation to a single sector ETF can produce wildly different outcomes depending on whether it replaces an existing core equity allocation or sits on top of one, whether it is rebalanced on a fixed schedule or allowed to drift, and whether the entry point was determined by a rule or by sentiment. The mechanics of how the position is constructed matter as much as which sector is selected.
Common position size frameworks used by institutional allocators tend to cluster around a few principles:
- Maximum single sector overlay of 10 to 15% of total portfolio equity allocation
- Rebalancing triggers set by deviation bands rather than calendar intervals, which forces selling into strength rather than waiting for an arbitrary date
- Correlation adjusted sizing that accounts for overlap with existing core holdings
- Entry rules tied to cycle indicators rather than recent price momentum, so the position is established before the consensus narrative has fully priced in the rotation
The 10 to 15% cap limits the damage from a misread cycle signal without eliminating the potential return contribution. Deviation band rebalancing runs counter to the behavioral tendency that destroys most tactical strategies, namely holding winners too long and cutting losers too late. Taken together, these principles represent the institutional discipline that retail sector ETF marketing glosses over entirely, which is precisely why the products generate consistent fee revenue regardless of whether the customer's timing is right.
The fee structure interacts with position sizing in a way that compounds over time. A 0.35% expense ratio on a 10% sector overlay position costs 0.035% of total portfolio value annually, which sounds trivial. Add three or four sector overlays, layer in transaction costs from active rebalancing, and factor in the tax drag from short term capital gains if positions turn over within twelve months, and the total friction cost on a tactical sector strategy can approach or exceed the expected alpha from the rotation itself. Low turnover and tax aware rebalancing are not secondary concerns. They are where most of the return either survives or disappears, and the expense ratio line on a fund fact sheet captures none of that friction.
Reading the Mid 2026 Sector Landscape as a Diagnostic Tool
The position sizing principles above are abstractions until they are applied to a live environment. As of mid 2026, the sector landscape reflects a specific set of macro conditions: a Federal Reserve that has been in a measured easing cycle since late 2024, a technology sector still commanding premium valuations on artificial intelligence capital expenditure narratives, and a domestic energy sector navigating the dual pressure of global supply normalization and accelerating electrification demand. These are not abstract forces. Each one produces a directional tilt in earnings expectations for specific sectors, and those tilts are visible in forward price to earnings ratios before they show up in price performance.
The AI infrastructure buildout has kept technology and utilities in an unusual correlation: data center power demand is creating an atypical earnings growth story in a sector that is conventionally defensive. That is a structural anomaly worth tracking closely, because it illustrates how sector classifications can misrepresent the actual earnings drivers of the underlying holdings. An investor treating XLU purely as a rate sensitive defensive play through 2025 and into 2026 was likely holding a meaningfully different risk profile than the label suggested. The product distributor benefits from that ambiguity. The end holder generally does not.
Healthcare spent much of 2025 and early 2026 under regulatory and reimbursement pressure in the United States, while the same sector's global components performed differently under distinct pricing environments. Sector ETFs domiciled and marketed to American investors typically weight heavily toward domestic large cap constituents, which means geopolitical and regulatory risk is embedded in the product whether or not the investor is tracking it. The sector label is the starting point for analysis, not the end of it.
The pattern worth watching going into the back half of 2026 is whether the late cycle compression signals that began appearing in credit markets in early 2026 translate into the defensive rotation that historical cycle mechanics would predict. If they do, it will look obvious in retrospect. The investors who positioned ahead of it will not have done so through perfect foresight. They will have done it by following a repeatable process that does not require being right every time, only more right than the behavioral mistakes that dominate most retail sector ETF flows. That is precisely the gap identified at the outset: the products were built to generate fee revenue across all eleven sectors regardless of cycle positioning, and the investor who closes that gap is the one who treats the sector label as a starting point, maps the real correlation and overlap, sizes the position against institutional principles, and accounts for the friction the expense ratio never discloses.
This article is for informational and educational purposes only and does not constitute financial, investment, legal, or insurance advice. The views expressed are analytical observations and should not be relied upon for personal financial decisions. Always consult a qualified financial advisor before making investment or insurance decisions.