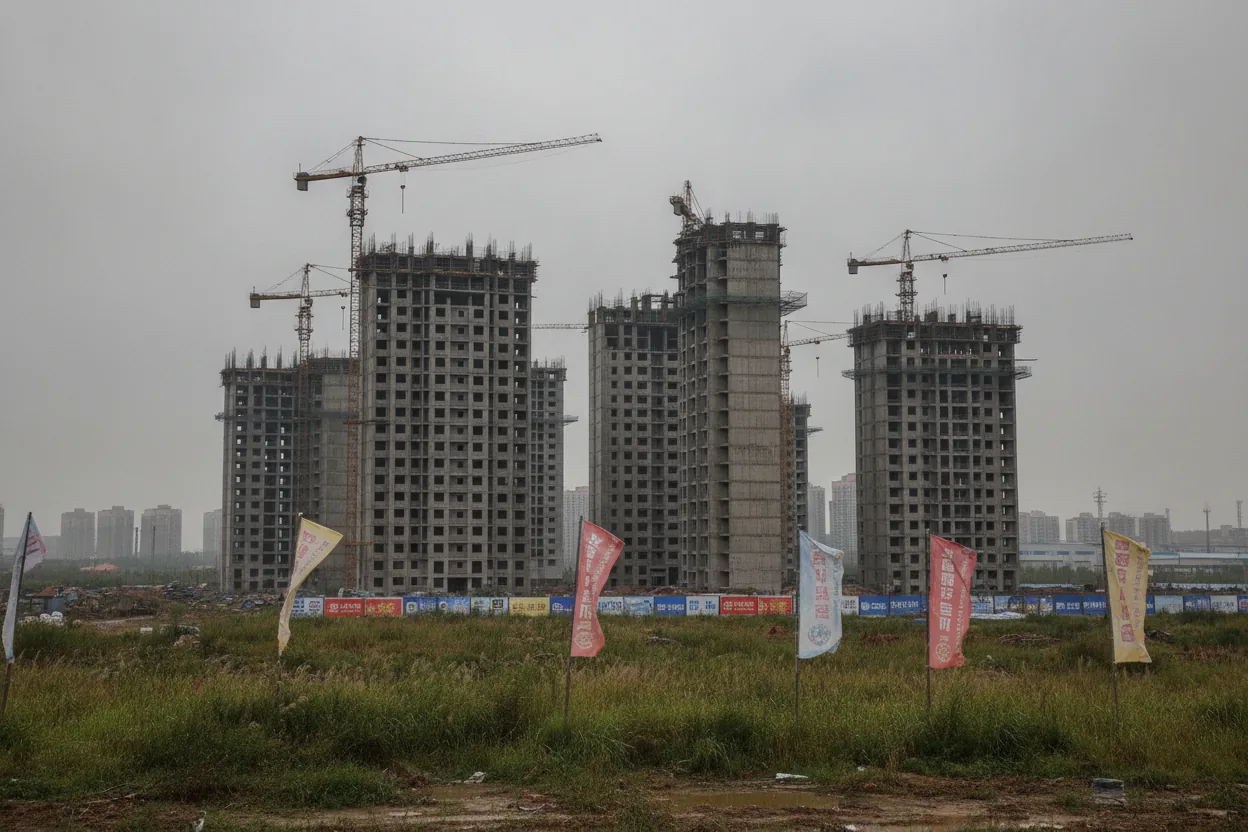
S&P Global Ratings revised its China property sales forecast from a 5% to 8% decline to a 10% to 14% decline. That swing is large enough to put 40% of rated Chinese developers under downgrade pressure. S&P built that stress model around the names it can actually see, while smaller unrated regional builders with thinner capital cushions carry no public credit visibility at all. The support tools Beijing has deployed since 2022 likely slowed the descent, but a market needs genuine demand to find a stable floor. The question worth working through is whether American investors holding emerging market funds, commodity ETFs, or multinationals with heavy China revenue have already absorbed that repricing, or whether they're still sitting in front of it.
For American investors with exposure to emerging market funds, Asia Pacific REITs, or companies with heavy China manufacturing and consumer revenue, this is not an abstract data point. The Chinese property sector represents roughly 20% to 25% of the country's GDP once upstream materials and downstream furnishings are included. A sustained price decline does not stay inside the property market.
The Supply Math Behind China's Property Glut
S&P China Property Forecast: Base Case vs Stress Scenario
S&P China Property Forecast: Base Case vs Stress Scenario
| Metric | Previous Forecast | Base Case (Revised) | Stress Scenario |
|---|---|---|---|
| Sales Decline | 5% to 8% | 10% to 14% | 10+ pts below base |
| Home Price Change (2026) | Not specified | -2% to -4% | Deeper decline |
| Rated Developers Under Pressure | Not specified | Fragile baseline | 40% face downgrade |
| Property Share of GDP | Not specified | 20% to 25% | Broad spillover risk |
Source: S&P Global Ratings, as cited in article
Source: S&P Global Ratings, as cited in article
China's housing glut did not appear overnight. It accumulated across roughly two decades of land sales fueling municipal revenue, developer leverage amplifying construction pipelines, and population projections that proved optimistic. The result is a primary housing market where supply significantly exceeds organic demand in most tier 2 and tier 3 cities. Prices in those markets have been falling since 2021, and the mechanism keeping them down is straightforward: when buyers expect further declines, they wait. Waiting reduces transaction volume, which reduces developer cash flow, which delays completion of existing projects, which makes buyers even more hesitant. The loop feeds itself.
S&P's current base case puts nationwide primary home price declines at 2% to 4% in 2026, broadly consistent with what the market experienced in 2025. That consistency is actually the concerning part. A market that stabilizes shows mean reversion. A market that posts similar negative numbers two years running is showing a structural floor that has not yet been found.
The stress scenario S&P outlines is more instructive than the base case. If contracted sales fall 10 percentage points below the base projection, four out of ten rated Chinese developers face downward rating pressure. A 40% hit rate among rated names means credit analysts are already pricing in meaningful default risk across a broad slice of the sector, not just at the most leveraged outliers. S&P set that stress threshold precisely because the base case trajectory already embeds significant fragility.
The mechanism matters here. Developers in China fund construction largely through presales: buyers pay before projects are completed. When presale volume drops, the cash pipeline that funds completion dries up. Projects stall. Buyers who paid early cannot get their units, trust in the presale model collapses further, and the whole thing tightens another notch. This feedback loop ran visibly with Evergrande starting in 2021 and has not fully unwound. The sector is still working through the consequences of that structural design, and a renewed sales decline accelerates the process.
Rating Pressure and What Downgrades Actually Trigger
The Presale Feedback Loop Driving China Property Distress
The Presale Feedback Loop Driving China Property Distress
Sales Volume Falls
Buyers expect further price declines and delay purchases
Developer Cash Flow Dries Up
Presale revenue that funds construction collapses
Projects Stall, Completions Delayed
Early buyers cannot receive their units
Credit Ratings Downgraded
Bond covenants triggered, forced selling, refinancing costs spike
Trust in Presale Model Collapses
Loop tightens, feeds back to Step 1
Source: Article analysis based on S&P Global Ratings commentary
Source: Article analysis based on S&P Global Ratings commentary
A credit rating downgrade on a Chinese developer is not a symbolic reassessment. It triggers a specific chain of financial mechanics. Bond covenants on offshore debt often include rating triggers that accelerate repayment schedules. Institutional investors with minimum credit quality mandates become forced sellers when ratings fall below their thresholds. Refinancing costs jump immediately, even for developers with relatively healthy balance sheets, because markets price the rating before the ink is dry on the agency report.
S&P's exclusion of China Vanke from its stress scenario counts is notable. Vanke has been operating under a state-assisted restructuring framework that insulates it from the same market pressures facing private developers. That distinction illustrates the two-speed nature of the sector: state-backed names have access to liquidity mechanisms that private names do not, which means aggregate sector statistics can mask a much harder landing at the private end of the market. Headline sector data will consistently read as less severe than the reality facing unlisted private builders. That's not a bug in how the data is reported. It's a feature of how the sector is structured.
The 40% downgrade exposure figure applies to rated developers only. Unrated developers, many of them smaller regional builders with even thinner capital cushions, carry no public credit visibility at all. The rated universe is the visible portion of the iceberg. What sits below it is a large number of regional developers whose distress will show up first in local government finances, contractor payment delays, and incomplete residential projects, not in any credit agency report. S&P built a stress model around the names it can see. The names it cannot see are the ones most likely to accelerate the timeline.
How China Property Stress Travels Into American Portfolios
The transmission channels from Chinese property stress into American investor portfolios are more numerous than most retail investors track. The primary routes:
- Emerging market equity funds with heavy China weighting
- High yield bond funds with exposure to Chinese developer offshore debt
- Commodities tied to Chinese construction demand, particularly copper, steel, and cement, which have been pricing in the slowdown since mid-2025
- Multinational consumer brands where China revenue represents a significant share of total earnings, a group that includes several S&P 500 names in consumer staples, luxury goods, and semiconductors
Each channel works differently. The equity channel responds to sentiment and earnings revision cycles. The bond channel responds to specific credit events and covenant triggers. The commodities channel responds to construction pipeline data, which leads underlying activity by several months. A 10% to 14% drop in primary property sales is a direct demand signal for construction materials, and the question for American investors holding broad commodity ETFs is whether that repricing is complete or whether further sales data revisions extend the move.
The consumer brand channel is slower and more opaque. A Chinese household facing falling home values tends to reduce discretionary spending, not immediately but over a 12 to 24 month lag as the wealth effect works through household psychology. Companies reporting China segment revenue in 2026 and 2027 earnings calls will be navigating that dynamic whether or not they explicitly connect it to property data. The threshold that puts multinationals in the most exposed category is roughly 15% or more of total revenue from Chinese consumers.
Why China Property Recovery Timelines Keep Getting Extended
Every time analysts set a recovery timeline for Chinese property, the timeline moves. The original expectation in late 2025 was a 5% to 8% sales decline, implying a manageable correction. By mid-2026 that estimate had been revised to 10% to 14%. This pattern of serial forecast revision is itself a data point. It suggests the supply absorption rate is slower than demand models assumed, which implies either weaker underlying demand or stickier inventory than the headline numbers captured. Forecasts that keep moving in one direction are telling you the model inputs were wrong, not just the outputs.
China's government has deployed multiple support tools since 2022: purchase restriction relaxations in most cities, mortgage rate cuts, state-sponsored purchases of completed but unsold inventory, and subsidized trade-in programs designed to stimulate upgrade buying. These tools likely slowed the descent. But a market needs genuine demand, not subsidy-bridged transactions, to find a stable floor. That distinction is what the S&P revision from 8% to 14% is ultimately measuring.
Demographics add a structural layer that policy cannot easily address. China's working-age population has been declining since approximately 2012, and the household formation rate that historically drove housing demand is compressing. Fewer young adults means fewer first-time buyers. In a market that structurally oversupplied into a shrinking demographic cohort, inventory absorption takes years rather than quarters. The tier 3 and tier 4 cities where supply is most extreme also happen to be the cities experiencing the most pronounced population outflow toward major urban centers, so supply rises precisely as demand relocates. That arithmetic is the core driver of the extended timeline, and no near-term policy tool reverses it quickly.
What the S&P analysis ultimately surfaces is a market where the support mechanisms are visible and documented, but the fundamental demand base required to clear existing inventory is not growing fast enough to match even a declining supply pipeline. The developers caught in that gap, particularly the unrated private names with no state backstop and no offshore capital access, are carrying risk that aggregate statistics will keep undercounting. S&P built its stress model around rated developers for a reason: those are the firms whose failure produces the bond market contagion that crosses into American portfolios. The private regional builders produce a slower, quieter version of the same damage, city by city, across a timeline that no quarterly report will cleanly capture.
This article is for informational and educational purposes only and does not constitute financial, investment, legal, or insurance advice. The views expressed are analytical observations and should not be relied upon for personal financial decisions. Always consult a qualified financial advisor before making investment or insurance decisions.